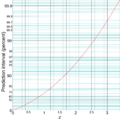
File:Standard score and prediction interval.png

本预览的尺寸:600 × 600像素。 其他分辨率:240 × 240像素 | 480 × 480像素 | 768 × 768像素 | 1,024 × 1,024像素 | 2,450 × 2,450像素。
原始文件 (2,450 × 2,450像素,文件大小:465 KB,MIME类型:image/png)
文件历史
点击某个日期/时间查看对应时刻的文件。
| 日期/时间 | 缩略图 | 大小 | 用户 | 备注 | |
|---|---|---|---|---|---|
| 当前 | 2012年5月6日 (日) 04:08 |  | 2,450 × 2,450(465 KB) | Mikael Häggström | {{Information |Description ={{en|1=Prediction interval (on the y-axis) given from the standard score (on the x-axis). The y-axis is logarithmically compressed (but the ... |
文件用途
以下页面使用本文件:
全域文件用途
以下其他wiki使用此文件:
- de.wikipedia.org上的用途
- es.wikipedia.org上的用途
- ja.wikipedia.org上的用途
- th.wikipedia.org上的用途


